If your processes are slow, inconsistent, and full of hidden waste, you are not aloneAcross the UK, businesses struggle with inefficiencies that quietly drain profit, delay delivery, and frustrate customers.
We analysed and tested dozens of Lean Six Sigma tools used by UK manufacturers, service providers, and consultants, then narrowed them down to the top 20. This guide is built for operations managers, quality professionals, consultants, and SMEs looking to improve performance.
According to UK manufacturing data, companies using Lean Six Sigma tools report up to 25 percent reduction in process waste and 20 percent improvement in operational efficiency. That is not theory. That is a measurable impact.
What are Lean Six Sigma Tools
Lean Six Sigma tools are structured methods used to improve processes by reducing waste and variation.They combine:
- Lean principles which focus on eliminating waste
- Six Sigma methods which focus on reducing defects and variation
In the UK, Lean Six Sigma tools are widely used in:
- Manufacturing
- Healthcare
- Finance
- Logistics
- Service industries
They are typically applied within the DMAIC framework:
- Define
- Measure
- Analyse
- Improve
- Control
The right Lean Six Sigma tools allow UK organisations to identify inefficiencies, fix root causes, and maintain consistent performance.
Quick Comparison Table for Lean Six Sigma Tools
We selected tools based on ease of use, analytical capability, data visualisation, integration, and suitability for UK industries. These are the key decision factors when choosing Lean Six Sigma tools.
| Tool | Best For | Type | Complexity | Key Feature | Industry Fit | Cost |
| SIPOC Diagram | Process overview | Mapping | Low | High-level view | All | Free |
| Value Stream Mapping | Waste analysis | Mapping | Medium | Flow visualisation | Manufacturing | Free |
| Fishbone Diagram | Root cause | Analysis | Low | Cause identification | All | Free |
| Pareto Chart | Prioritisation | Analysis | Low | 80/20 rule | All | Free |
| Control Charts | Monitoring | Statistical | High | Process stability | Manufacturing | Medium |
| Histogram | Data analysis | Statistical | Medium | Distribution view | All | Free |
| Scatter Plot | Correlation | Analysis | Medium | Relationship insight | All | Free |
| FMEA | Risk analysis | Planning | High | Failure prevention | Engineering | Medium |
| 5 Whys | Root cause | Analysis | Low | Simple questioning | All | Free |
| Kaizen | Continuous improvement | Method | Medium | Small changes | All | Low |
| Kanban | Workflow | Visual | Low | Task flow | Services | Low |
| Poka-Yoke | Error proofing | Design | Medium | Mistake prevention | Manufacturing | Medium |
| DMAIC | Framework | Strategy | High | Structured improvement | All | Free |
| Benchmarking | Performance comparison | Strategy | Medium | Best practices | All | Medium |
| Process Mapping | Workflow design | Mapping | Low | Visual processes | All | Free |
| Root Cause Analysis | Problem solving | Analysis | Medium | Issue resolution | All | Free |
| SPC | Process control | Statistical | High | Data monitoring | Manufacturing | Medium |
| Voice of Customer | Customer insights | Research | Medium | Feedback analysis | Services | Low |
| Gemba Walk | Observation | Method | Low | Real-world insight | Manufacturing | Free |
| Standard Work | Process control | Documentation | Medium | Consistency | All | Low |
SIPOC Diagram – High-Level Process Clarity for UK Operations
The SIPOC Diagram is one of the most widely used Lean Six Sigma tools in the UK for defining processes at a high level before diving into detailed analysis.
SIPOC stands for:
- Suppliers
- Inputs
- Process
- Outputs
- Customers
In this SIPOC diagram review, it is often the starting point in the DMAIC framework. In the SIPOC vs process mapping comparison, SIPOC provides a high-level overview, while process mapping goes deeper into steps.For UK businesses, it is essential when aligning teams before improvement work begins.
Key Features
High-Level Process Overview
The SIPOC diagram gives UK teams a clear snapshot of how a process works from start to finish. It avoids unnecessary detail and focuses on the big picture, which is critical during the Define phase of Lean Six Sigma projects.
Stakeholder Alignment
One of the strongest SIPOC diagram features is alignment. UK teams can quickly understand who is involved, what inputs are required, and what outputs are delivered, reducing confusion early in projects.
Simple and Structured Format
The SIPOC format is easy to follow. UK professionals can create it without advanced tools, making it accessible across departments, from manufacturing to service industries.
Foundation for Process Improvement
SIPOC acts as the base for deeper analysis. UK teams use it before applying other Lean Six Sigma tools like value stream mapping or root cause analysis.
Cross-Functional Visibility
It highlights interactions between suppliers and customers. UK organisations can identify gaps between departments and improve collaboration.
Pros and Cons
| Pros | Cons |
| Easy to create | Lacks detail |
| Great for alignment | Not for deep analysis |
| Clear structure | High-level only |
| Works across industries | Needs follow-up tools |
Usage / Cost
SIPOC diagram usage in the UK:
- Completely free to use
- Can be created in Excel, PowerPoint, or whiteboards
- No specialised software required
Compared to SIPOC alternatives like detailed process mapping, it is simpler but less granular.
Best for UK Teams Starting Process Improvement Projects
The SIPOC diagram is ideal for early-stage analysis and alignment.
- UK SMEs — defining workflows
- Operations teams — process clarity
- Consultants — project scoping
- Manufacturing teams — supplier mapping
Verdict: If you are starting a Lean Six Sigma project in the UK, SIPOC is one of the most essential Lean Six Sigma tools to use first.
How to Use SIPOC Diagram in UK Businesses
Start by identifying the process you want to improve. Then map suppliers, inputs, process steps, outputs, and customers in a structured table.
For UK teams, this ensures everyone understands the process before making changes.
Quick tip: Keep SIPOC diagrams simple. Overcomplicating them defeats their purpose.
Best SIPOC Alternative
If you are exploring alternatives, process mapping is the next step. In the SIPOC vs process mapping comparison, process maps provide more detail after SIPOC sets the foundation.
Value Stream Mapping – Visualise and Eliminate Waste in UK Processes
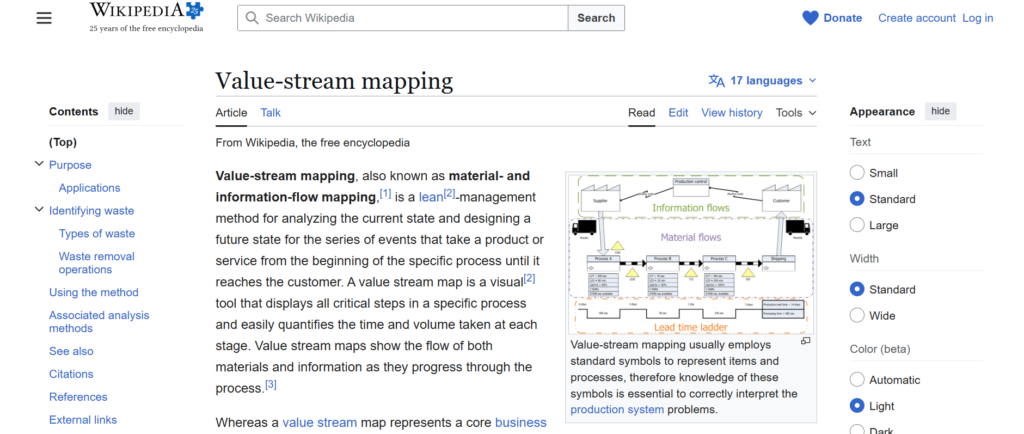
Value Stream Mapping (VSM) is one of the most powerful Lean Six Sigma tools used across the UK to visualise entire processes and identify waste.
In this Value Stream Mapping review, the focus is on tracking every step involved in delivering a product or service. In the Value Stream Mapping vs SIPOC comparison, SIPOC gives a high-level view, while VSM dives deeper into process flow, timing, and inefficiencies.
For UK manufacturers and service providers, this tool is essential for spotting delays, bottlenecks, and non-value-added activities.
Key Features
End-to-End Process Visualisation
Value Stream Mapping allows UK teams to map the full journey of a product or service. From raw input to final delivery, every step is documented, helping teams see where time and resources are being wasted.
Identification of Waste (Muda)
One of the strongest Value Stream Mapping features is waste detection. UK businesses can identify delays, overproduction, unnecessary movement, and defects that reduce efficiency.
Time and Cycle Analysis
VSM includes data such as cycle time, lead time, and waiting time. UK teams can measure how long each step takes and identify where improvements will have the biggest impact.
Current vs Future State Mapping
UK organisations can create a current state map to analyse existing processes and a future state map to design improvements. This makes VSM a practical tool for transformation.
Cross-Department Visibility
Value Stream Mapping highlights how departments interact. UK businesses can uncover communication gaps and inefficiencies between teams.
Pros and Cons
| Pros | Cons |
| Identifies waste clearly | Time-consuming to create |
| Improves process flow | Requires accurate data |
| Works across industries | Needs training |
| Supports transformation | Can be complex |
Usage / Cost
Value Stream Mapping usage in the UK:
- Free to implement
- Can be created using whiteboards or software tools
- Often used in Lean Six Sigma projects
Compared to Value Stream Mapping alternatives like basic process mapping, VSM provides deeper insights but requires more effort.
Best for UK Manufacturing and Operations Teams
Value Stream Mapping is ideal for organisations focused on efficiency and waste reduction.
- UK manufacturers — production optimisation
- Logistics teams — supply chain flow
- SMEs — process improvement
- Operations managers — efficiency gains
Verdict: If you want to eliminate waste and improve flow, Value Stream Mapping is one of the most impactful Lean Six Sigma tools available in the UK.
How to Use Value Stream Mapping in UK Businesses
Start by mapping your current process from start to finish. Include data such as cycle times and delays.
Then create a future state map that removes waste and improves flow.
For UK teams, this provides a clear roadmap for process improvement.
Quick tip: Focus on one process at a time to avoid complexity and ensure accurate mapping.
Best Value Stream Mapping Alternative
If you are exploring alternatives, process mapping is a simpler option. In the Value Stream Mapping vs process mapping comparison, VSM provides deeper analysis, while process mapping is easier to create.
Fishbone Diagram – Root Cause Analysis for UK Process Problems
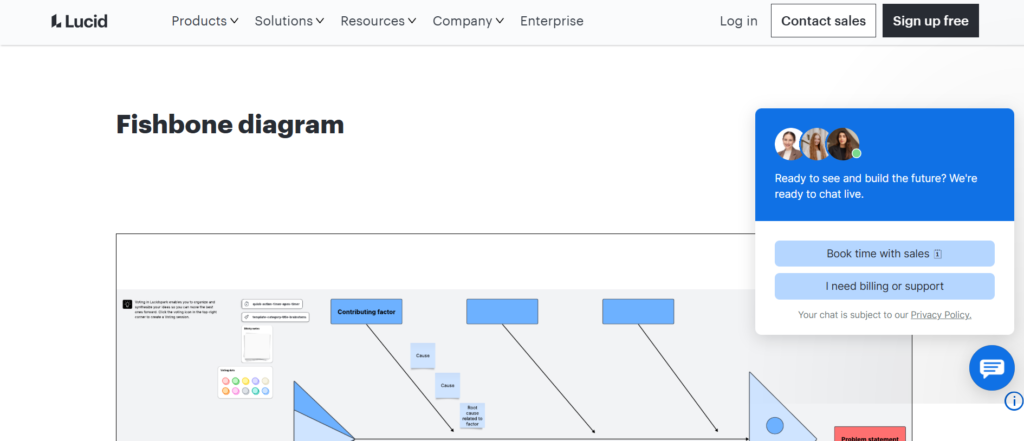
The Fishbone Diagram, also known as the Ishikawa Diagram, is one of the most practical Lean Six Sigma tools used across the UK to identify root causes of problems.
In this Fishbone Diagram review, the tool focuses on breaking down issues into categories such as people, process, equipment, and environment. In the Fishbone Diagram vs 5 Whys comparison, Fishbone provides a structured visual approach, while 5 Whys is simpler and more direct.
For UK teams dealing with recurring issues, this tool is essential.
Key Features
Structured Root Cause Identification
The Fishbone Diagram helps UK teams systematically identify possible causes of a problem. Instead of guessing, teams explore multiple categories to uncover deeper issues affecting performance.
Visual Problem Breakdown
One of the strongest Fishbone Diagram features is its visual layout. UK users can clearly see how different factors contribute to a problem, making it easier to analyse complex situations.
Category-Based Analysis
Causes are grouped into categories such as manpower, methods, machines, materials, and environment. This ensures UK teams do not overlook critical factors during analysis.
Collaborative Problem Solving
The diagram works well in group settings. UK teams can brainstorm causes together, improving engagement and generating better insights.
Works Across Industries
From manufacturing to healthcare, UK organisations use Fishbone Diagrams to analyse quality issues, delays, and operational inefficiencies.
Pros and Cons
| Pros | Cons |
| Easy to understand | Can become complex |
| Visual structure | Needs facilitation |
| Great for teams | Not data-driven |
| Identifies multiple causes | Requires follow-up |
Usage / Cost
Fishbone Diagram usage in the UK:
- Free to use
- Can be created using whiteboards or software
- Common in Lean Six Sigma workshops
Compared to Fishbone Diagram alternatives like 5 Whys, it is more structured but slightly more complex.
Best for UK Teams Solving Recurring Problems
The Fishbone Diagram is ideal for identifying root causes in complex situations.
- UK manufacturers — defect analysis
- Healthcare teams — process issues
- SMEs — operational challenges
- Quality teams — problem-solving
Verdict: If you need to understand why problems keep happening, the Fishbone Diagram is one of the most effective Lean Six Sigma tools in the UK.
How to Use Fishbone Diagram in UK Businesses
Start by defining the problem clearly. Draw a central “spine” and branch out categories of potential causes.
Then brainstorm possible causes under each category with your team.
For UK organisations, this ensures a thorough and structured approach to problem-solving.
Quick tip: Combine Fishbone Diagram with data analysis tools to validate root causes.
Best Fishbone Diagram Alternative
If you are exploring alternatives, 5 Whys is a simpler option. In the Fishbone Diagram vs 5 Whys comparison, Fishbone is more comprehensive, while 5 Whys is quicker.
Pareto Chart – Focus on What Matters Most in UK Processes
The Pareto Chart is one of the most widely used Lean Six Sigma tools in the UK for prioritising problems based on impact.Built on the 80/20 principle, it shows that roughly 80 percent of problems come from 20 percent of causes.
In this Pareto Chart review, the tool helps UK teams focus on the issues that matter most. In the Pareto Chart vs Histogram comparison, Pareto prioritises causes, while histograms show data distribution.For UK businesses dealing with multiple issues, this tool brings clarity fast.
Key Features
80/20 Prioritisation Principle
The Pareto Chart helps UK teams identify the small number of causes creating the biggest problems. This ensures time and resources are spent where they deliver the highest impact.
Visual Data Representation
One of the strongest Pareto Chart features is its combination of bar charts and a cumulative line. UK users can quickly see which issues dominate and how they contribute overall.
Data-Driven Decision Making
The chart relies on real data. UK organisations can move away from assumptions and make decisions based on measurable insights.
Easy to Interpret
Pareto Charts are simple to understand. UK teams across departments can use them without advanced statistical knowledge.
Works Across Industries
From manufacturing defects to customer complaints, UK businesses use Pareto Charts to prioritise improvements in any process.
Pros and Cons
| Pros | Cons |
| Easy to understand | Requires accurate data |
| Highlights priorities | Not root cause analysis |
| Quick insights | Limited depth |
| Works across industries | Needs follow-up tools |
Usage / Cost
Pareto Chart usage in the UK:
- Free to create using Excel or BI tools
- Widely used in Lean Six Sigma projects
- No specialised software required
Compared to Pareto Chart alternatives like Fishbone Diagram, it focuses on prioritisation rather than root cause analysis.
Best for UK Teams Prioritising Process Issues
The Pareto Chart is ideal for focusing improvement efforts.
- UK manufacturers — defect prioritisation
- Customer service teams — complaint analysis
- SMEs — problem prioritisation
- Quality teams — data-driven decisions
Verdict: If you are dealing with multiple issues and limited resources, the Pareto Chart is one of the most practical Lean Six Sigma tools in the UK.
How to Use Pareto Chart in UK Businesses
Start by collecting data on issues such as defects or complaints. Then rank them from most frequent to least.
Plot the data as bars and add a cumulative percentage line.
For UK teams, this quickly highlights where to focus improvement efforts.
Quick tip: Always follow Pareto analysis with root cause tools like Fishbone Diagram.
Best Pareto Chart Alternative
If you are exploring alternatives, histograms are useful for analysing data distribution. In the Pareto Chart vs Histogram comparison, Pareto prioritises issues, while histograms show variation.
Control Charts – Monitor Process Stability for UK Operations
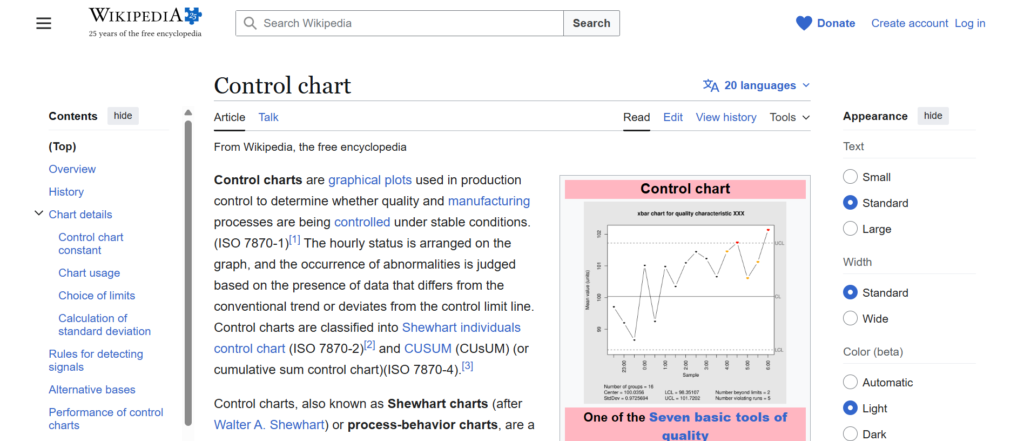
Control Charts are one of the most data-driven Lean Six Sigma tools used across the UK to monitor process performance over time.
In this Control Charts review, the tool helps UK teams distinguish between normal process variation and actual problems. In the Control Charts vs Histogram comparison, histograms show distribution, while control charts track performance over time.
For UK manufacturers and operations teams, this tool is essential for maintaining consistency.
Key Features
Real-Time Process Monitoring
Control Charts allow UK teams to track process performance continuously. By plotting data over time, organisations can quickly identify trends, shifts, or unusual patterns.
Upper and Lower Control Limits
One of the most important Control Charts features is the use of control limits. These limits help UK teams understand whether a process is stable or if corrective action is needed.
Detection of Variation
Control Charts distinguish between common cause variation and special cause variation. UK teams can avoid overreacting to normal fluctuations while addressing real issues.
Data-Driven Decision Making
The tool relies on actual performance data. UK organisations can base decisions on facts rather than assumptions, improving process control.
Widely Used in Quality Management
From manufacturing to healthcare, Control Charts are a standard tool for quality assurance in the UK.
Pros and Cons
| Pros | Cons |
| Strong data insights | Requires statistical knowledge |
| Tracks performance over time | Needs consistent data |
| Identifies variation | Setup can be complex |
| Improves process control | Not beginner-friendly |
Usage / Cost
Control Charts usage in the UK:
- Free using Excel or statistical tools
- Often used in Six Sigma projects
- Available in software like Minitab
Compared to Control Charts alternatives like histograms, they provide ongoing monitoring rather than static analysis.
Best for UK Teams Monitoring Process Performance
Control Charts are ideal for organisations focused on quality and consistency.
- UK manufacturers — quality control
- Healthcare teams — patient process tracking
- SMEs — performance monitoring
- Quality managers — process stability
Verdict: If you need to maintain consistent performance, Control Charts are one of the most essential Lean Six Sigma tools in the UK.
How to Use Control Charts in UK Businesses
Start by collecting process data over time. Plot the data on a chart with a central line and control limits.
Monitor the chart for trends, spikes, or points outside the limits.
For UK teams, this ensures early detection of process issues before they escalate.
Quick tip: Do not react to every fluctuation. Focus only on signals that fall outside control limits.
Best Control Charts Alternative
If you are exploring alternatives, histograms are useful for analysing data distribution. In the Control Charts vs Histogram comparison, control charts track trends, while histograms show variation at a single point in time.
Histogram – Understand Data Distribution in UK Processes
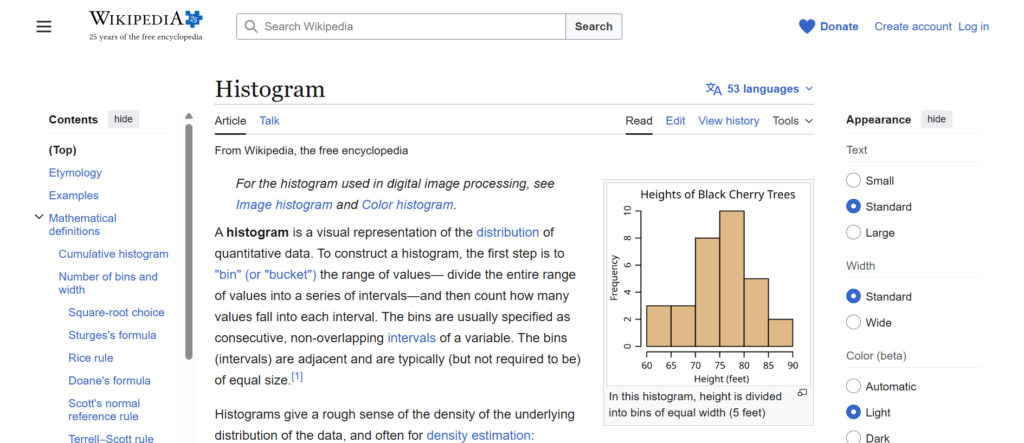
The Histogram is one of the most essential Lean Six Sigma tools used in the UK for analysing how data is distributed within a process.
In this Histogram review, the tool helps UK teams visualise patterns, variation, and frequency of data points. In the Histogram vs Pareto Chart comparison, histograms show distribution, while Pareto charts prioritise issues.
For UK businesses dealing with performance data, histograms provide clarity quickly.
Key Features
Visual Data Distribution
Histograms display data in bars that show frequency. UK teams can instantly see how values are spread, whether clustered, skewed, or evenly distributed.
Identification of Variation
One of the key Histogram features is identifying variation. UK organisations can detect inconsistencies in processes that may lead to defects or inefficiencies.
Easy Pattern Recognition
Histograms make it simple to identify trends such as peaks, gaps, or unusual patterns. UK teams can quickly understand process behaviour without complex analysis.
Supports Data-Driven Decisions
By visualising real data, histograms help UK businesses move away from assumptions and base decisions on measurable insights.
Works Across Multiple Industries
From manufacturing to service delivery, histograms are widely used across UK industries to analyse performance data.
Pros and Cons
| Pros | Cons |
| Easy to create | Requires data collection |
| Clear visual insights | No prioritisation |
| Identifies variation | Static view only |
| Widely applicable | Needs interpretation |
Usage / Cost
Histogram usage in the UK:
- Free using Excel or BI tools
- Common in Lean Six Sigma analysis
- No specialised software required
Compared to Histogram alternatives like Control Charts, histograms provide a snapshot rather than continuous monitoring.
Best for UK Teams Analysing Process Data
Histograms are ideal for understanding performance and variation.
- UK manufacturers — defect analysis
- Service teams — response times
- SMEs — performance tracking
- Quality teams — data analysis
Verdict: If you want to understand how your data behaves, histograms are one of the most practical Lean Six Sigma tools in the UK.
How to Use Histogram in UK Businesses
Start by collecting data from your process. Group the data into ranges and plot frequency bars.
Analyse the shape of the histogram to identify variation and patterns.
For UK teams, this helps highlight inconsistencies that need improvement.
Quick tip: Combine histograms with control charts for deeper process insights.
Best Histogram Alternative
If you are exploring alternatives, control charts are a strong option. In the Histogram vs Control Charts comparison, histograms show distribution, while control charts track performance over time.
Scatter Plot – Identify Relationships in UK Process Data

The Scatter Plot is one of the most insightful Lean Six Sigma tools used in the UK to identify relationships between two variables.
In this Scatter Plot review, the tool helps UK teams understand whether changes in one factor affect another. In the Scatter Plot vs Histogram comparison, scatter plots show relationships, while histograms show distribution.
For UK businesses analysing cause-and-effect, this tool is essential.
Key Features
Visual Correlation Analysis
Scatter Plots allow UK teams to plot two variables on a graph and see if there is a relationship. This helps identify whether one factor influences another in a process.
Identification of Trends
One of the strongest Scatter Plot features is spotting trends. UK users can quickly see positive, negative, or no correlation between variables.
Supports Root Cause Analysis
Scatter Plots are often used alongside other Lean Six Sigma tools like Fishbone Diagrams. UK teams can validate suspected causes with real data.
Simple Data Visualisation
The tool is easy to create and interpret. UK professionals can use it without advanced statistical expertise.
Applicable Across Industries
From manufacturing to finance, UK organisations use Scatter Plots to analyse performance and identify improvement opportunities.
Pros and Cons
| Pros | Cons |
| Easy to create | Requires paired data |
| Shows relationships clearly | Does not prove causation |
| Supports analysis | Limited depth |
| Visual insights | Needs interpretation |
Usage / Cost
Scatter Plot usage in the UK:
- Free using Excel or BI tools
- Common in Lean Six Sigma analysis
- No specialised software required
Compared to Scatter Plot alternatives like control charts, scatter plots focus on relationships rather than trends over time.
Best for UK Teams Analysing Cause and Effect
Scatter Plots are ideal for identifying relationships between variables.
- UK manufacturers — process variables
- Finance teams — performance analysis
- SMEs — data insights
- Quality teams — root cause validation
Verdict: If you want to understand how variables interact, Scatter Plots are one of the most valuable Lean Six Sigma tools in the UK.
How to Use Scatter Plot in UK Businesses
Start by collecting paired data for two variables. Plot one variable on the X-axis and the other on the Y-axis.
Look for patterns or trends that indicate correlation.
For UK teams, this helps validate assumptions with real data.
Quick tip: Always combine scatter plots with other tools to confirm root causes.
Best Scatter Plot Alternative
If you are exploring alternatives, control charts are useful for tracking performance over time. In the Scatter Plot vs Control Charts comparison, scatter plots show relationships, while control charts show trends.
Failure Mode and Effects Analysis (FMEA) – Prevent Risks in UK Processes

Failure Mode and Effects Analysis (FMEA) is one of the most proactive Lean Six Sigma tools used in the UK to identify and prevent potential failures before they occur.
In this FMEA review, the tool focuses on analysing risks within processes, products, or systems. In the FMEA vs Fishbone Diagram comparison, Fishbone identifies causes after problems occur, while FMEA prevents them in advance.
For UK engineering, manufacturing, and healthcare sectors, this tool is critical.
Key Features
Risk Identification and Prioritisation
FMEA allows UK teams to identify potential failure points in a process. Each risk is scored based on severity, occurrence, and detection, helping teams prioritise what to fix first.
Structured Risk Assessment Framework
One of the strongest FMEA features is its structured approach. UK organisations can systematically analyse processes and ensure no potential failure is overlooked.
Focus on Prevention
Unlike reactive tools, FMEA focuses on preventing issues before they happen. This reduces costly defects and operational disruptions in UK businesses.
Risk Priority Number (RPN)
FMEA uses RPN to rank risks. UK teams can focus on high-impact failures and allocate resources effectively.
Cross-Functional Collaboration
FMEA requires input from multiple departments. UK teams can collaborate to identify risks from different perspectives, improving overall analysis.
Pros and Cons
| Pros | Cons |
| Prevents failures | Time-consuming |
| Structured analysis | Requires training |
| Prioritises risks | Can be complex |
| Improves quality | Needs accurate data |
Usage / Cost
FMEA usage in the UK:
- Free to implement using spreadsheets
- Common in manufacturing and engineering
- Often supported by quality management software
Compared to FMEA alternatives like root cause analysis, FMEA is proactive rather than reactive.
Best for UK Teams Focused on Risk Prevention
FMEA is ideal for organisations that want to avoid failures before they occur.
- UK manufacturers — defect prevention
- Engineering teams — product design
- Healthcare — patient safety
- SMEs — risk management
Verdict: If you want to reduce risk and prevent costly errors, FMEA is one of the most powerful Lean Six Sigma tools in the UK.
How to Use FMEA in UK Businesses
Start by identifying potential failure points in a process. Assign scores for severity, occurrence, and detection.
Calculate the Risk Priority Number and prioritise high-risk areas.
For UK teams, this ensures proactive improvement and risk reduction.
Quick tip: Review FMEA regularly as processes change to keep risk analysis relevant.
Best FMEA Alternative
If you are exploring alternatives, Fishbone Diagram is useful for analysing causes after issues occur. In the FMEA vs Fishbone comparison, FMEA prevents problems, while Fishbone investigates them.
5 Whys – Simple Root Cause Analysis for UK Teams
The 5 Whys method is one of the simplest yet most effective Lean Six Sigma tools used across the UK to identify the root cause of a problem.
In this 5 Whys review, the approach focuses on asking “why” repeatedly until the real cause is uncovered. In the 5 Whys vs Fishbone Diagram comparison, 5 Whys is quicker and simpler, while Fishbone is more structured.
For UK teams that need fast problem-solving without complexity, this tool is essential.
Key Features
Simple Question-Based Analysis
The 5 Whys method involves asking “why” multiple times to drill down into the root cause. UK teams can uncover deeper issues without needing complex tools or data.
Fast and Easy to Apply
One of the strongest 5 Whys features is speed. UK teams can use it during meetings or on the shop floor to quickly identify problems and take action.
Focus on Root Cause
Instead of addressing symptoms, the 5 Whys method pushes UK organisations to identify the underlying cause of an issue, leading to more effective solutions.
No Special Tools Required
The method can be applied using pen and paper or basic tools. This makes it accessible for all UK businesses, regardless of size or industry.
Encourages Team Collaboration
The 5 Whys works well in group discussions. UK teams can brainstorm answers together, improving understanding and engagement.
Pros and Cons
| Pros | Cons |
| Very easy to use | Can oversimplify problems |
| No cost | Depends on facilitator |
| Quick results | Not data-driven |
| Works anywhere | May miss complex causes |
Usage / Cost
5 Whys usage in the UK:
- Completely free
- No software required
- Used in workshops and daily operations
Compared to 5 Whys alternatives like Fishbone Diagram, it is faster but less detailed.
Best for UK Teams Solving Problems Quickly
The 5 Whys method is ideal for quick root cause analysis.
- UK SMEs — quick problem-solving
- Manufacturing teams — shop floor issues
- Service teams — operational problems
- Managers — decision making
Verdict: If you need a fast and practical way to identify root causes, the 5 Whys is one of the most useful Lean Six Sigma tools in the UK.
How to Use 5 Whys in UK Businesses
Start with a clear problem statement. Ask “why” the problem occurred and write down the answer.
Repeat the process at least five times until you reach the root cause.
For UK teams, this helps move from symptoms to real solutions quickly.
Quick tip: Do not stop too early. The real cause often appears after the third or fourth “why”.
Best 5 Whys Alternative
If you are exploring alternatives, Fishbone Diagram is a more structured option. In the 5 Whys vs Fishbone comparison, Fishbone provides a broader analysis, while 5 Whys is quicker.
Kaizen – Continuous Improvement for UK Businesses

Kaizen is one of the most widely adopted Lean Six Sigma tools in the UK, focused on continuous, incremental improvement across processes.
In this Kaizen review, the method emphasises small, consistent changes rather than large transformations. In the Kaizen vs DMAIC comparison, Kaizen is ongoing and flexible, while DMAIC is structured and project-based.
For UK organisations aiming to build a culture of improvement, Kaizen is essential.
Key Features
Continuous Improvement Culture
Kaizen encourages UK teams to make small improvements regularly. Over time, these changes compound into significant performance gains without major disruption.
Employee Involvement
One of the strongest Kaizen features is team engagement. UK employees at all levels are encouraged to suggest improvements, increasing ownership and accountability.
Focus on Waste Reduction
Kaizen targets inefficiencies in processes. UK businesses can reduce waste in time, materials, and effort, improving overall productivity.
Easy Implementation
Kaizen does not require complex tools or systems. UK organisations can start with simple changes and gradually build a structured improvement process.
Works Across All Industries
From manufacturing to healthcare and services, Kaizen is widely used across UK industries to improve operations.
Pros and Cons
| Pros | Cons |
| Builds improvement culture | Slow results initially |
| Easy to implement | Requires commitment |
| Engages employees | Needs consistency |
| Low cost | Hard to measure impact |
Usage / Cost
Kaizen usage in the UK:
- Low cost to implement
- No specialised software required
- Often used alongside other Lean Six Sigma tools
Compared to Kaizen alternatives like DMAIC, it is less structured but more flexible.
Best for UK Organisations Building Continuous Improvement Culture
Kaizen is ideal for businesses that want ongoing improvement.
- UK manufacturers — process optimisation
- SMEs — gradual improvement
- Service teams — workflow efficiency
- Operations teams — waste reduction
Verdict: If you want long-term improvement without major disruption, Kaizen is one of the most effective Lean Six Sigma tools in the UK.
How to Use Kaizen in UK Businesses
Start by encouraging employees to identify small improvements in daily work.
Implement changes quickly and monitor results.
For UK teams, consistency is key to making Kaizen effective.
Quick tip: Track small wins to maintain motivation and engagement across teams.
Best Kaizen Alternative
If you are exploring alternatives, DMAIC provides a more structured approach. In the Kaizen vs DMAIC comparison, Kaizen focuses on continuous improvement, while DMAIC is project-driven.
Kanban – Visual Workflow Management for UK Teams
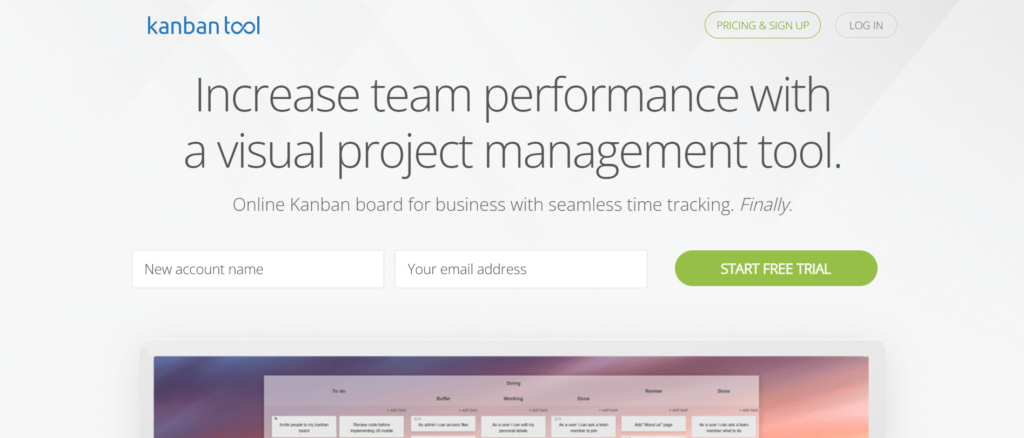
Kanban is one of the most practical Lean Six Sigma tools used across the UK to manage workflow and improve efficiency through visual task tracking.
In this Kanban review, the method focuses on visualising work in progress and limiting bottlenecks. In the Kanban vs Kaizen comparison, Kanban is more visual and workflow-focused, while Kaizen centres on continuous improvement culture.
For UK teams managing tasks, projects, and operations, Kanban is highly effective.
Key Features
Visual Workflow Boards
Kanban uses boards with columns such as “To Do”, “In Progress”, and “Done”. UK teams can instantly see the status of tasks, improving clarity and accountability.
Work-in-Progress Limits
One of the strongest Kanban features is limiting how many tasks can be active at once. UK teams can reduce overload and improve focus, leading to faster completion times.
Continuous Flow Management
Kanban helps maintain a steady workflow. UK organisations can identify bottlenecks and ensure tasks move smoothly from start to finish.
Flexibility Across Teams
Kanban is adaptable. UK businesses can use it in IT, marketing, operations, and customer service without changing core principles.
Easy Integration with Digital Tools
Kanban boards can be physical or digital. UK teams often use tools like Trello or Jira to manage workflows digitally.
Pros and Cons
| Pros | Cons |
| Easy to understand | Can lack structure |
| Improves visibility | Not ideal for complex projects |
| Reduces bottlenecks | Requires discipline |
| Flexible usage | Limited strategic depth |
Usage / Cost
Kanban usage in the UK:
- Free with physical boards
- Low-cost digital tools available
- Widely used in agile and Lean environments
Compared to Kanban alternatives like Scrum, it is more flexible but less structured.
Best for UK Teams Managing Workflows and Tasks
Kanban is ideal for teams that need visibility and control over tasks.
- UK SMEs — task management
- IT teams — agile workflows
- Marketing teams — campaign tracking
- Operations teams — process flow
Verdict: If you want to improve workflow visibility and reduce bottlenecks, Kanban is one of the most effective Lean Six Sigma tools in the UK.
How to Use Kanban in UK Businesses
Start by creating a board with columns representing stages of work. Add tasks as cards and move them across the board as they progress.
Set limits on tasks in progress to avoid overload.
For UK teams, this ensures smoother workflows and better productivity.
Quick tip: Review your Kanban board daily to identify and remove bottlenecks quickly.
Best Kanban Alternative
If you are exploring alternatives, Scrum is a structured option. In the Kanban vs Scrum comparison, Kanban is flexible, while Scrum follows fixed sprints.
Poka-Yoke – Error Proofing for UK Process Reliability
Poka-Yoke, also known as mistake-proofing, is one of the most practical Lean Six Sigma tools used in the UK to prevent errors before they happen.
In this Poka-Yoke review, the focus is on designing processes in a way that makes mistakes impossible or immediately detectable. In the Poka-Yoke vs FMEA comparison, FMEA identifies risks, while Poka-Yoke eliminates them through design.
For UK manufacturers, service providers, and operations teams, this tool is essential for improving quality.
Key Features
Error Prevention by Design
Poka-Yoke ensures that processes are designed to prevent mistakes. UK teams can eliminate human error by simplifying steps or adding safeguards.
Immediate Error Detection
If prevention is not possible, Poka-Yoke ensures errors are detected instantly. UK businesses can fix issues before they impact customers or operations.
Simple and Practical Implementation
One of the strongest Poka-Yoke features is simplicity. UK teams can implement solutions without complex systems or high costs.
Improves Quality and Consistency
By reducing errors, Poka-Yoke helps UK organisations maintain consistent output and reduce defects across processes.
Applicable Across Industries
From manufacturing to healthcare and services, Poka-Yoke is widely used across the UK to improve reliability.
Pros and Cons
| Pros | Cons |
| Prevents errors | Not always possible |
| Improves quality | Requires process redesign |
| Low cost | Limited to specific issues |
| Easy to apply | Needs creativity |
Usage / Cost
Poka-Yoke usage in the UK:
- Low cost to implement
- No specialised software required
- Often used in manufacturing and operations
Compared to Poka-Yoke alternatives like FMEA, it focuses on prevention rather than analysis.
Best for UK Teams Focused on Error Reduction
Poka-Yoke is ideal for organisations aiming to eliminate defects.
- UK manufacturers — defect prevention
- Healthcare teams — patient safety
- SMEs — process reliability
- Operations teams — quality control
Verdict: If you want to eliminate errors at the source, Poka-Yoke is one of the most effective Lean Six Sigma tools in the UK.
How to Use Poka-Yoke in UK Businesses
Start by identifying common errors in your process. Then redesign steps to prevent those mistakes or detect them immediately.
For UK teams, even small changes can significantly improve quality.
Quick tip: Focus on high-impact errors first to maximise results.
Best Poka-Yoke Alternative
If you are exploring alternatives, FMEA is a strong option. In the Poka-Yoke vs FMEA comparison, FMEA identifies risks, while Poka-Yoke prevents them.
DMAIC Framework – Structured Problem Solving for UK Organisations

The DMAIC Framework is the backbone of most Lean Six Sigma tools used across the UK for structured process improvement.
DMAIC stands for:
- Define
- Measure
- Analyse
- Improve
- Control
In this DMAIC review, it provides a step-by-step approach to solving complex problems. In the DMAIC vs Kaizen comparison, DMAIC is structured and project-driven, while Kaizen focuses on continuous small improvements.
For UK organisations handling complex operational challenges, DMAIC is essential.
Key Features
Structured Problem-Solving Approach
DMAIC gives UK teams a clear roadmap from problem identification to long-term control. This reduces guesswork and ensures consistent improvement outcomes.
Data-Driven Decision Making
One of the strongest DMAIC features is its reliance on data. UK businesses collect and analyse data at each stage, ensuring decisions are based on facts rather than assumptions.
Focus on Measurable Results
DMAIC ensures improvements are measurable. UK teams can track performance before and after changes, proving the value of Lean Six Sigma initiatives.
Integration with Other Tools
DMAIC acts as a framework that incorporates other Lean Six Sigma tools such as SIPOC, Fishbone Diagram, and Control Charts.
Long-Term Process Control
The final stage ensures improvements are sustained. UK organisations can maintain gains and prevent processes from slipping back.
Pros and Cons
| Pros | Cons |
| Structured approach | Time-intensive |
| Data-driven | Requires training |
| Measurable results | Can be complex |
| Scalable | Needs commitment |
Usage / Cost
DMAIC usage in the UK:
- Free framework
- Requires training and expertise
- Widely used in Six Sigma projects
Compared to DMAIC alternatives like Kaizen, it is more structured but less flexible.
Best for UK Teams Handling Complex Process Improvements
DMAIC is ideal for organisations tackling major challenges.
- UK manufacturers — quality improvement
- Healthcare — process optimisation
- SMEs — structured projects
- Consultants — client solutions
Verdict: If you need a proven, structured approach to process improvement, DMAIC is one of the most important Lean Six Sigma tools in the UK.
How to Use DMAIC in UK Businesses
Start by clearly defining the problem. Measure current performance, analyse root causes, implement improvements, and control the process to sustain results.
For UK teams, following each stage carefully ensures long-term success.
Quick tip: Do not skip steps. Each phase builds on the previous one for effective results.
Best DMAIC Alternative
If you are exploring alternatives, Kaizen is a flexible option. In the DMAIC vs Kaizen comparison, DMAIC is structured, while Kaizen is continuous.
DMAIC Framework – Structured Problem Solving for UK Organisations

The DMAIC Framework is the backbone of most Lean Six Sigma tools used in the UK. It provides a structured, data-driven approach to improving processes.
DMAIC stands for:
- Define
- Measure
- Analyse
- Improve
- Control
In this DMAIC review, the framework is used to guide entire improvement projects. In the DMAIC vs Kaizen comparison, DMAIC is structured and project-based, while Kaizen focuses on continuous small improvements.
For UK organisations tackling complex problems, DMAIC is essential.
Key Features
Structured Problem-Solving Approach
DMAIC provides a clear roadmap for improvement. UK teams follow defined stages, ensuring no critical step is missed during process optimisation.
Data-Driven Decision Making
One of the strongest DMAIC features is its reliance on data. UK organisations base decisions on measurable insights rather than assumptions, improving accuracy.
Focus on Root Cause Analysis
DMAIC ensures that UK teams identify the true cause of problems before implementing solutions, reducing the risk of recurring issues.
Continuous Monitoring and Control
The Control phase ensures improvements are sustained. UK businesses can maintain performance gains and prevent processes from slipping back.
Scalable Across Industries
From manufacturing to finance and healthcare, DMAIC is widely used across UK industries for process improvement.
Pros and Cons
| Pros | Cons |
| Structured approach | Time-consuming |
| Data-driven | Requires training |
| Scalable | Can be complex |
| Long-term results | Resource intensive |
Usage / Cost
DMAIC usage in the UK:
- Free framework
- Requires training and expertise
- Often used in Six Sigma certification programmes
Compared to DMAIC alternatives like Kaizen, it is more structured but less flexible.
Best for UK Teams Handling Complex Process Improvements
DMAIC is ideal for organisations dealing with major challenges.
- UK manufacturers — quality improvement
- Financial services — process optimisation
- Healthcare — patient flow improvement
- SMEs — structured problem-solving
Verdict: If you need a proven, structured approach to solving complex problems, DMAIC is one of the most important Lean Six Sigma tools in the UK.
How to Use DMAIC in UK Businesses
Start by defining the problem clearly. Measure current performance, analyse root causes, implement improvements, and control the process.
For UK teams, this ensures a disciplined and effective improvement process.
Quick tip: Do not skip phases. Each step is critical for long-term success.
Best DMAIC Alternative
If you are exploring alternatives, Kaizen is a flexible option. In the DMAIC vs Kaizen comparison, DMAIC is project-driven, while Kaizen focuses on continuous improvement.
Benchmarking – Compare and Improve Performance in UK Businesses
Benchmarking is one of the most strategic Lean Six Sigma tools used in the UK to compare performance against industry standards or competitors.
In this Benchmarking review, the focus is on identifying gaps between your current performance and best-in-class organisations. In the Benchmarking vs DMAIC comparison, DMAIC improves internal processes, while benchmarking looks outward for improvement opportunities.
For UK businesses aiming to stay competitive, this tool is critical.
Key Features
Performance Comparison
Benchmarking allows UK organisations to compare their processes, costs, and performance with industry leaders. This helps identify where improvements are needed.
Identification of Best Practices
One of the strongest Benchmarking features is learning from others. UK teams can adopt proven strategies and processes instead of reinventing solutions.
Gap Analysis
Benchmarking highlights performance gaps. UK businesses can clearly see where they fall short and prioritise improvement efforts accordingly.
Supports Strategic Decision Making
By using real data from competitors or industry standards, UK organisations can make informed decisions about process improvements and investments.
Applicable Across Industries
Benchmarking is used across UK sectors including manufacturing, finance, healthcare, and retail to improve competitiveness.
Pros and Cons
| Pros | Cons |
| Identifies improvement gaps | Data can be hard to access |
| Learns from best practices | Time-consuming |
| Supports strategy | May not fit all contexts |
| Improves competitiveness | Requires analysis |
Usage / Cost
Benchmarking usage in the UK:
- Low to medium cost depending on data sources
- Requires research and analysis
- Often used in strategic planning
Compared to Benchmarking alternatives like internal analysis tools, it focuses on external comparison rather than internal performance.
Best for UK Businesses Seeking Competitive Advantage
Benchmarking is ideal for organisations aiming to improve performance relative to others.
- UK corporates — strategic planning
- SMEs — performance improvement
- Manufacturing — efficiency comparison
- Service industries — customer experience
Verdict: If you want to understand how your business compares to the best, Benchmarking is one of the most valuable Lean Six Sigma tools in the UK.
How to Use Benchmarking in UK Businesses
Start by identifying key performance metrics. Then compare your results with industry standards or competitors.
Analyse the gaps and develop strategies to close them.
For UK teams, this provides a clear direction for improvement.
Quick tip: Focus on relevant benchmarks that match your industry and business size.
Best Benchmarking Alternative
If you are exploring alternatives, internal performance analysis is a simpler option. In the Benchmarking vs internal analysis comparison, benchmarking provides external insights, while internal analysis focuses on your own data.
Process Mapping – Visualise Workflows for UK Efficiency
Process Mapping is one of the most widely used Lean Six Sigma tools in the UK for visualising workflows and identifying inefficiencies.
In this Process Mapping review, the tool focuses on documenting each step in a process to improve clarity and performance. In the Process Mapping vs Value Stream Mapping comparison, process mapping is simpler and more detailed at the step level, while VSM focuses on flow and waste.
For UK businesses aiming to improve operations, this tool is fundamental.
Key Features
Step-by-Step Workflow Visualisation
Process Mapping allows UK teams to break down processes into individual steps. This helps identify inefficiencies, redundancies, and unnecessary complexity in workflows.
Improved Process Clarity
One of the strongest Process Mapping features is clarity. UK teams can clearly understand how tasks are performed, reducing confusion and miscommunication.
Identification of Bottlenecks
By visualising workflows, UK organisations can easily spot delays and bottlenecks that impact performance and productivity.
Supports Standardisation
Process Mapping helps create consistent workflows. UK businesses can standardise processes to improve quality and reduce variation.
Easy to Create and Use
The tool is simple and accessible. UK teams can create process maps using basic tools like flowcharts or digital whiteboards.
Pros and Cons
| Pros | Cons |
| Easy to understand | Can become detailed |
| Improves clarity | Needs updates |
| Identifies inefficiencies | Time-consuming |
| Works across industries | Limited analysis depth |
Usage / Cost
Process Mapping usage in the UK:
- Free to implement
- Can be created using simple tools
- Widely used in Lean Six Sigma projects
Compared to Process Mapping alternatives like Value Stream Mapping, it is simpler but less focused on waste analysis.
Best for UK Teams Improving Workflow Clarity
Process Mapping is ideal for organisations looking to understand and improve workflows.
- UK SMEs — workflow optimisation
- Operations teams — process clarity
- Service industries — customer journey mapping
- Manufacturing — production steps
Verdict: If you want to clearly understand how your processes work, Process Mapping is one of the most essential Lean Six Sigma tools in the UK.
How to Use Process Mapping in UK Businesses
Start by identifying a process and listing each step involved. Create a visual flowchart to represent the workflow.
Review the map to identify inefficiencies and areas for improvement.
For UK teams, this provides a clear foundation for optimisation.
Quick tip: Keep maps simple and update them regularly as processes change.
Best Process Mapping Alternative
If you are exploring alternatives, Value Stream Mapping is a more advanced option. In the Process Mapping vs Value Stream Mapping comparison, VSM focuses on waste and flow, while process mapping focuses on steps.
Root Cause Analysis – Solve Problems Permanently in UK Businesses
Root Cause Analysis (RCA) is one of the most critical Lean Six Sigma tools used across the UK to identify the underlying causes of problems rather than just treating symptoms.
In this Root Cause Analysis review, the focus is on digging deep into issues to prevent recurrence. In the Root Cause Analysis vs 5 Whys comparison, 5 Whys is a method within RCA, while RCA is a broader approach using multiple techniques.
For UK organisations dealing with recurring issues, RCA is essential.
Key Features
Deep Problem Investigation
Root Cause Analysis enables UK teams to go beyond surface-level issues. By analysing data and processes, organisations can uncover the true source of problems.
Use of Multiple Techniques
One of the strongest Root Cause Analysis features is flexibility. UK teams can use tools like Fishbone Diagrams, 5 Whys, and Scatter Plots within RCA.
Prevents Recurring Issues
By addressing root causes, RCA ensures problems do not return. UK businesses can achieve long-term improvements instead of temporary fixes.
Data-Driven Insights
RCA relies on evidence and analysis. UK organisations can make informed decisions based on facts rather than assumptions.
Cross-Functional Collaboration
RCA often involves multiple teams. UK businesses can gain broader insights and improve collaboration during problem-solving.
Pros and Cons
| Pros | Cons |
| Solves problems permanently | Time-consuming |
| Uses multiple tools | Requires expertise |
| Improves quality | Needs accurate data |
| Prevents recurrence | Can be complex |
Usage / Cost
Root Cause Analysis usage in the UK:
- Free to implement
- Uses existing Lean Six Sigma tools
- Widely used in quality and operations
Compared to Root Cause Analysis alternatives like 5 Whys, RCA is more comprehensive but requires more effort.
Best for UK Teams Facing Recurring Issues
Root Cause Analysis is ideal for organisations that want long-term solutions.
- UK manufacturers — defect reduction
- Healthcare — patient safety
- SMEs — operational issues
- Quality teams — continuous improvement
Verdict: If you want to eliminate problems permanently, Root Cause Analysis is one of the most important Lean Six Sigma tools in the UK.
How to Use Root Cause Analysis in UK Businesses
Start by defining the problem clearly. Use tools like Fishbone Diagram or 5 Whys to identify potential causes.
Validate findings with data and implement solutions targeting the root cause.
For UK teams, this ensures long-term improvement and stability.
Quick tip: Always verify the root cause with data before implementing solutions.
Best Root Cause Analysis Alternative
If you are exploring alternatives, 5 Whys is a quicker option. In the Root Cause Analysis vs 5 Whys comparison, RCA is comprehensive, while 5 Whys is faster.
Statistical Process Control (SPC) – Maintain Quality in UK Operations

Statistical Process Control (SPC) is one of the most advanced Lean Six Sigma tools used in the UK to monitor and control processes using statistical methods.
In this SPC review, the focus is on using data to ensure processes remain stable and predictable. In the SPC vs Control Charts comparison, control charts are a core component of SPC, while SPC is the broader system.
For UK manufacturers and quality-driven organisations, SPC is essential.
Key Features
Continuous Process Monitoring
SPC allows UK teams to monitor processes in real time using data. This helps detect variations early before they turn into major issues.
Use of Statistical Tools
One of the strongest SPC features is its use of multiple statistical methods, including control charts, histograms, and scatter plots. UK organisations can gain deeper insights into process behaviour.
Reduction of Process Variation
SPC focuses on minimising variation. UK businesses can achieve consistent output and improve product or service quality.
Early Detection of Issues
By identifying trends and deviations, SPC enables UK teams to act quickly and prevent defects or failures.
Improves Quality Management Systems
SPC is widely used in UK quality management systems to maintain high standards and compliance.
Pros and Cons
| Pros | Cons |
| Strong data insights | Requires statistical knowledge |
| Improves consistency | Needs continuous data |
| Prevents defects | Complex to implement |
| Supports quality systems | Training required |
Usage / Cost
SPC usage in the UK:
- Medium cost depending on tools used
- Often implemented using statistical software
- Common in manufacturing and engineering
Compared to SPC alternatives like basic control charts, SPC provides a more comprehensive approach.
Best for UK Organisations Focused on Quality Control
SPC is ideal for businesses that require consistent and reliable processes.
- UK manufacturers — production quality
- Engineering teams — process control
- Healthcare — patient process monitoring
- SMEs — quality improvement
Verdict: If maintaining consistent quality is critical, SPC is one of the most powerful Lean Six Sigma tools in the UK.
How to Use SPC in UK Businesses
Start by collecting process data and applying statistical tools such as control charts.
Monitor trends and identify variations that fall outside acceptable limits.
For UK teams, this ensures consistent performance and early problem detection.
Quick tip: Combine SPC with DMAIC for structured and data-driven improvement projects.
Best SPC Alternative
If you are exploring alternatives, control charts are a simpler option. In the SPC vs Control Charts comparison, SPC is broader, while control charts focus on monitoring.
Voice of Customer (VOC) – Capture Customer Needs in UK Businesses

Voice of Customer (VOC) is one of the most customer-focused Lean Six Sigma tools used in the UK to gather and analyse customer feedback.
In this Voice of Customer review, the tool helps UK organisations understand what customers truly need and expect. In the VOC vs Benchmarking comparison, benchmarking compares performance, while VOC captures direct customer insights.
For UK businesses focused on improving customer experience, VOC is essential.
Key Features
Customer Feedback Collection
VOC enables UK teams to gather feedback through surveys, interviews, complaints, and reviews. This provides direct insight into customer expectations and pain points.
Identification of Customer Needs
One of the strongest VOC features is translating feedback into actionable requirements. UK organisations can align processes with what customers actually value.
Data-Driven Customer Insights
VOC converts qualitative feedback into measurable data. UK teams can identify trends and prioritise improvements based on customer impact.
Supports Product and Service Improvement
By understanding customer expectations, UK businesses can refine products and services to increase satisfaction and loyalty.
Integration with Lean Six Sigma Projects
VOC is often used in the Define phase of DMAIC. UK teams can ensure improvement efforts are aligned with customer needs.
Pros and Cons
| Pros | Cons |
| Improves customer focus | Requires data collection |
| Provides real insights | Can be time-consuming |
| Supports decision making | Needs analysis |
| Works across industries | Feedback may vary |
Usage / Cost
Voice of Customer usage in the UK:
- Low to medium cost depending on tools
- Uses surveys, interviews, and analytics
- Common in service and retail industries
Compared to VOC alternatives like internal analysis, it focuses on external customer input rather than internal data.
Best for UK Businesses Focused on Customer Experience
VOC is ideal for organisations that want to align processes with customer expectations.
- UK retailers — customer satisfaction
- Service providers — experience improvement
- SMEs — feedback-driven growth
- Marketing teams — customer insights
Verdict: If you want to improve customer satisfaction and align your processes with real needs, VOC is one of the most valuable Lean Six Sigma tools in the UK.
How to Use Voice of Customer in UK Businesses
Start by collecting customer feedback through surveys, interviews, or online reviews.
Analyse the data to identify common themes and expectations.
For UK teams, this ensures improvement efforts are aligned with what customers value most.
Quick tip: Combine VOC with Pareto analysis to prioritise the most critical customer issues.
Best Voice of Customer Alternative
If you are exploring alternatives, benchmarking is a strong option. In the VOC vs Benchmarking comparison, VOC captures customer feedback, while benchmarking compares performance.
Gemba Walk – Real-World Process Observation for UK Teams
Gemba Walk is one of the most practical Lean Six Sigma tools used in the UK, focused on observing processes where the work actually happens.
“Gemba” means “the real place” in Japanese. In this Gemba Walk review, the method encourages UK leaders and managers to go to the source of operations instead of relying on reports.
In the Gemba Walk vs Process Mapping comparison, process mapping shows how work should happen, while Gemba Walk shows how it actually happens.
For UK businesses aiming to uncover real issues, this tool is essential.
Key Features
Real-World Observation
Gemba Walk allows UK teams to observe processes directly on the shop floor or in the workplace. This helps identify issues that are often missed in reports or data.
Direct Employee Engagement
One of the strongest Gemba Walk features is interaction with employees. UK managers can speak with staff, understand challenges, and gather insights from those doing the work.
Identification of Hidden Waste
By observing processes in action, UK organisations can uncover inefficiencies such as delays, unnecessary movement, or rework that are not documented.
Immediate Problem Awareness
Gemba Walk helps UK teams identify problems in real time. This allows quicker decision-making and faster improvements.
Supports Continuous Improvement Culture
Regular Gemba Walks encourage a culture of accountability and improvement across UK organisations.
Pros and Cons
| Pros | Cons |
| Real insights | Time-consuming |
| Improves communication | Requires discipline |
| Identifies hidden issues | Not data-driven |
| Builds engagement | Needs consistency |
Usage / Cost
Gemba Walk usage in the UK:
- Completely free
- No tools or software required
- Widely used in manufacturing and operations
Compared to Gemba Walk alternatives like data analysis tools, it focuses on observation rather than data.
Best for UK Teams Seeking Real Operational Insights
Gemba Walk is ideal for organisations that want to understand real processes.
- UK manufacturers — shop floor insights
- Operations teams — workflow observation
- SMEs — process improvement
- Managers — employee engagement
Verdict: If you want to understand what is really happening in your operations, Gemba Walk is one of the most valuable Lean Six Sigma tools in the UK.
How to Use Gemba Walk in UK Businesses
Start by visiting the workplace where the process occurs. Observe without interrupting and ask questions to understand the workflow.
Engage with employees and take notes on inefficiencies.
For UK teams, this ensures decisions are based on real-world insights.
Quick tip: Do not treat Gemba Walk as an audit. Focus on learning, not blaming.
Best Gemba Walk Alternative
If you are exploring alternatives, process mapping is a structured option. In the Gemba Walk vs Process Mapping comparison, Gemba provides real insights, while process mapping provides a planned view.
Standard Work – Ensure Consistency in UK Processes
Standard Work is one of the most essential Lean Six Sigma tools used in the UK to document and maintain consistent processes.
In this Standard Work review, the focus is on creating clear, repeatable procedures that ensure tasks are performed the same way every time. In the Standard Work vs Process Mapping comparison, process mapping shows the flow, while Standard Work defines exactly how each step should be executed.
For UK businesses aiming for consistency and quality, this tool is critical.
Key Features
Documented Best Practices
Standard Work captures the most efficient way to perform a task. UK teams can follow proven methods instead of relying on guesswork or individual habits.
Consistency Across Operations
One of the strongest Standard Work features is consistency. UK organisations can ensure that processes are performed uniformly, reducing variation and errors.
Training and Onboarding Support
Standard Work documents are useful for training new employees. UK businesses can quickly bring staff up to speed with clear instructions.
Performance Stability
By standardising processes, UK teams can maintain stable performance and improve quality over time.
Foundation for Continuous Improvement
Standard Work provides a baseline. UK organisations can measure improvements against it and update processes as they evolve.
Pros and Cons
| Pros | Cons |
| Ensures consistency | Requires regular updates |
| Improves quality | Can be rigid |
| Supports training | Time to create |
| Reduces errors | Needs enforcement |
Usage / Cost
Standard Work usage in the UK:
- Low cost to implement
- Created using documents or simple tools
- Widely used in Lean environments
Compared to Standard Work alternatives like process mapping, it is more detailed and execution-focused.
Best for UK Organisations Focused on Consistency and Quality
Standard Work is ideal for maintaining reliable processes.
- UK manufacturers — production consistency
- SMEs — operational control
- Service teams — standard procedures
- Operations teams — quality assurance
Verdict: If you want consistent, repeatable results, Standard Work is one of the most important Lean Six Sigma tools in the UK.
How to Use Standard Work in UK Businesses
Start by documenting the best way to perform a task. Include clear steps, timings, and responsibilities.
Train employees to follow the standard and monitor compliance.
For UK teams, this ensures stable performance and continuous improvement.
Quick tip: Review and update Standard Work regularly to reflect process improvements.
Best Standard Work Alternative
If you are exploring alternatives, process mapping is a useful starting point. In the Standard Work vs Process Mapping comparison, process mapping shows flow, while Standard Work defines execution.
Lean Six Sigma Tools That Actually Drive Results in the UK
Here is the truth most consultants will not tell you.Lean Six Sigma tools do not fail.Poor execution does.You now have a complete breakdown of the top 20 Lean Six Sigma tools used across the UK. From SIPOC and Value Stream Mapping to DMAIC and Standard Work, each tool solves a specific problem.
But the real advantage comes when you use the right Lean Six Sigma tools at the right time.
- Use SIPOC and VOC to define problems clearly
- Use Fishbone, 5 Whys, and RCA to find root causes
- Use Pareto and Scatter Plots to prioritise and validate
- Use DMAIC and SPC to implement and control improvements
- Use Kaizen and Standard Work to sustain results
This is how UK businesses reduce waste, improve quality, and increase profitability without guesswork.The opportunity is simple.Apply these Lean Six Sigma tools correctly, and your processes will start working for you instead of against you.
Work With Pearl Lemon
If you are serious about implementing Lean Six Sigma tools in your UK business, this is where Pearl Lemon comes in.
We do not just talk about process improvement.We build systems that deliver measurable results.Here is what you get when you work with Pearl Lemon:
- Full Lean Six Sigma process audits tailored for UK businesses
- Identification of waste, bottlenecks, and inefficiencies
- Implementation of the right Lean Six Sigma tools for your operations
- Ongoing optimisation and performance tracking
- Training your team to sustain improvements long-term
Whether you are a startup, SME, or established company in the UK, we turn inefficient processes into streamlined systems that increase output and reduce cost.If your operations feel slow, inconsistent, or unpredictable, now is the time to fix it.
FAQs
1. What are Lean Six Sigma tools used for
Lean Six Sigma tools are used to improve processes, reduce waste, and increase efficiency in UK businesses.
2. Which Lean Six Sigma tools should UK businesses start with
Start with SIPOC, Process Mapping, and 5 Whys before moving to advanced tools like DMAIC and SPC.
3. Are Lean Six Sigma tools suitable for small UK businesses
Yes, many Lean Six Sigma tools are simple and low cost, making them ideal for SMEs.
4. How long does it take to see results
UK businesses can start seeing improvements within weeks if the right tools are applied correctly.
5. Do Lean Six Sigma tools require software
No, many Lean Six Sigma tools can be implemented using basic tools like Excel or whiteboards.
6. Can Pearl Lemon implement Lean Six Sigma tools for my business
Yes, Pearl Lemon provides full implementation, training, and optimisation services for UK businesses.
7. Which industries benefit most in the UK
Manufacturing, healthcare, finance, logistics, and service industries benefit the most.
8. Are Lean Six Sigma tools difficult to learn
Some tools require training, but many are simple and easy to apply.
9. How do I choose the right Lean Six Sigma tools
It depends on your business goals, process complexity, and current challenges.
10. What is the biggest benefit of Lean Six Sigma tools
The biggest benefit is improved efficiency, reduced waste, and better process consistency.
Meta Title and Meta Description
Meta Title:
Best Lean Six Sigma Tools UK 2026
Meta Description:
Top 20 Lean Six Sigma tools in the UK with practical use cases for process improvement and quality control.